Web developers often struggle with the ability to debug their code and see what is causing elements to look out of place. In one of our previous articles we looked at the best browser for web development, and in this article we will look at how you can use one of those browsers to your advantage and how you can test, debug and experiment directly from the window where people will be viewing your website.
For the purposes of this guide we will be using Google Chrome. However, most if not all of these tips are available in other browsers and are probably located in the exact same places.
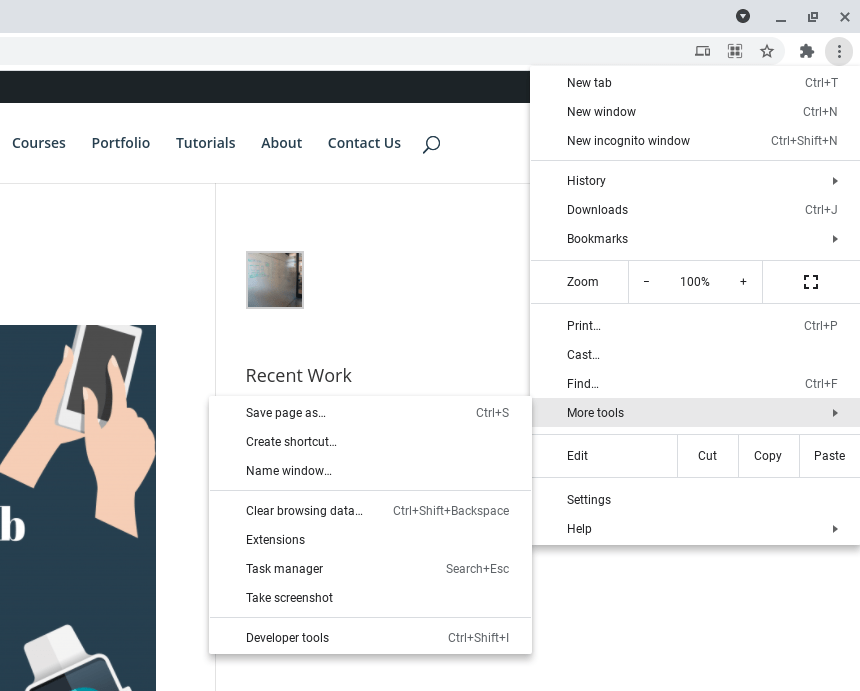
Firstly let's open up the developer tools. To do this click the 3 vertical dots on the top right of your browser to open the settings menu. Then hover over "More tools" and select "Developer tools" at the very bottom of the sub-menu. This will open a developer console pane.
The pane has a few tabs but the ones of interest are Elements, Console, Sources, Network and Application. To be clear the other options are also very useful however this is more of a bigger article and the other tabs involve a bit more set up in order to use. In a later article we will look at the advanced developer options within browsers.
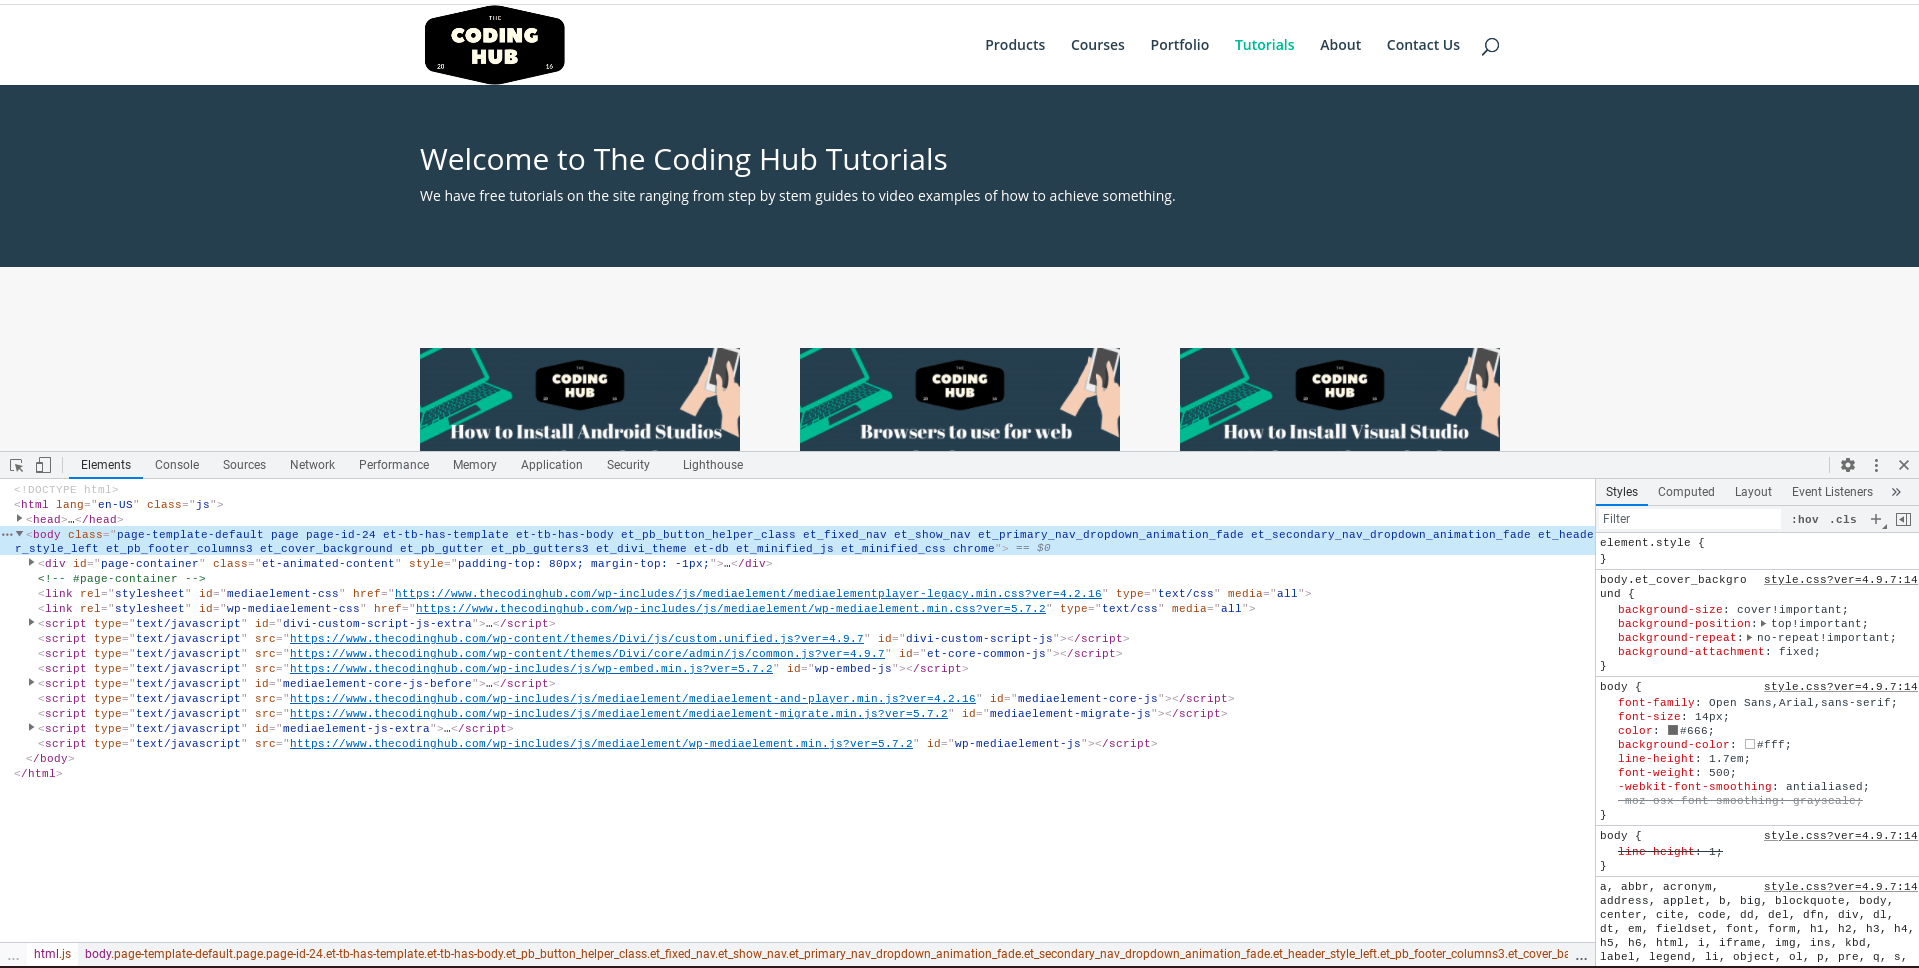
Elements
The elements tab might appear as just a lot of HTML code at first however it is so much more than that. The big pane on the left are all your HTML elements on the page as loaded to the user. The arrow on the top left is probably one of the most useful developer options available
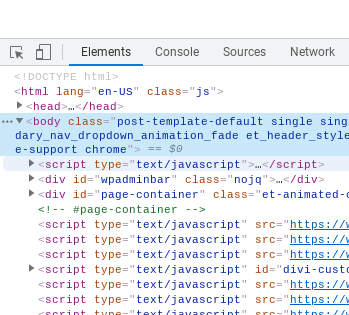
Click this arrow will allow you to select an Element on the page with your mouse cursor. This will then automatically open the correct element in the elements pane inside the HTML. Why is this so useful? Well firstly you can review the element code. Secondly you can alter the code to test something without doing code edits and re-compiling any code. Thirdly and probably the biggest benefit is you can alter the css code to test new styles. On the right you have a CSS and styling pane where you can review and change things to see how they will apear. This is great for testing and trialing things.

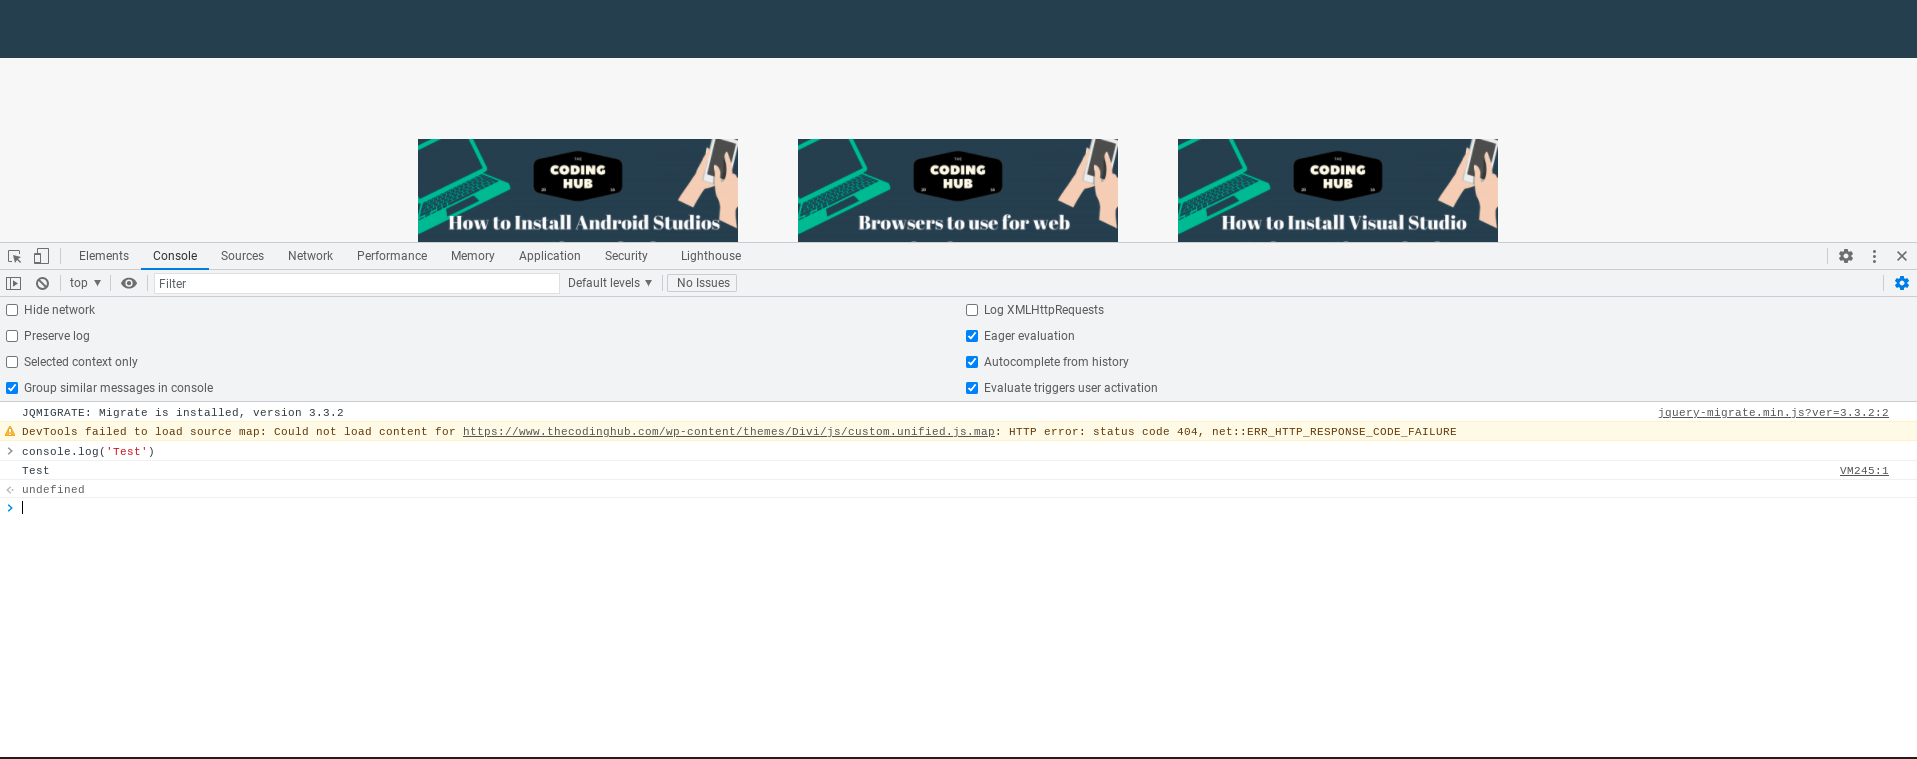
Console
The console tab in the developer tools is a great debugging tool too. You can run javascript code and immediately see the result. It gives a great way to debug and run code to see what would happen.
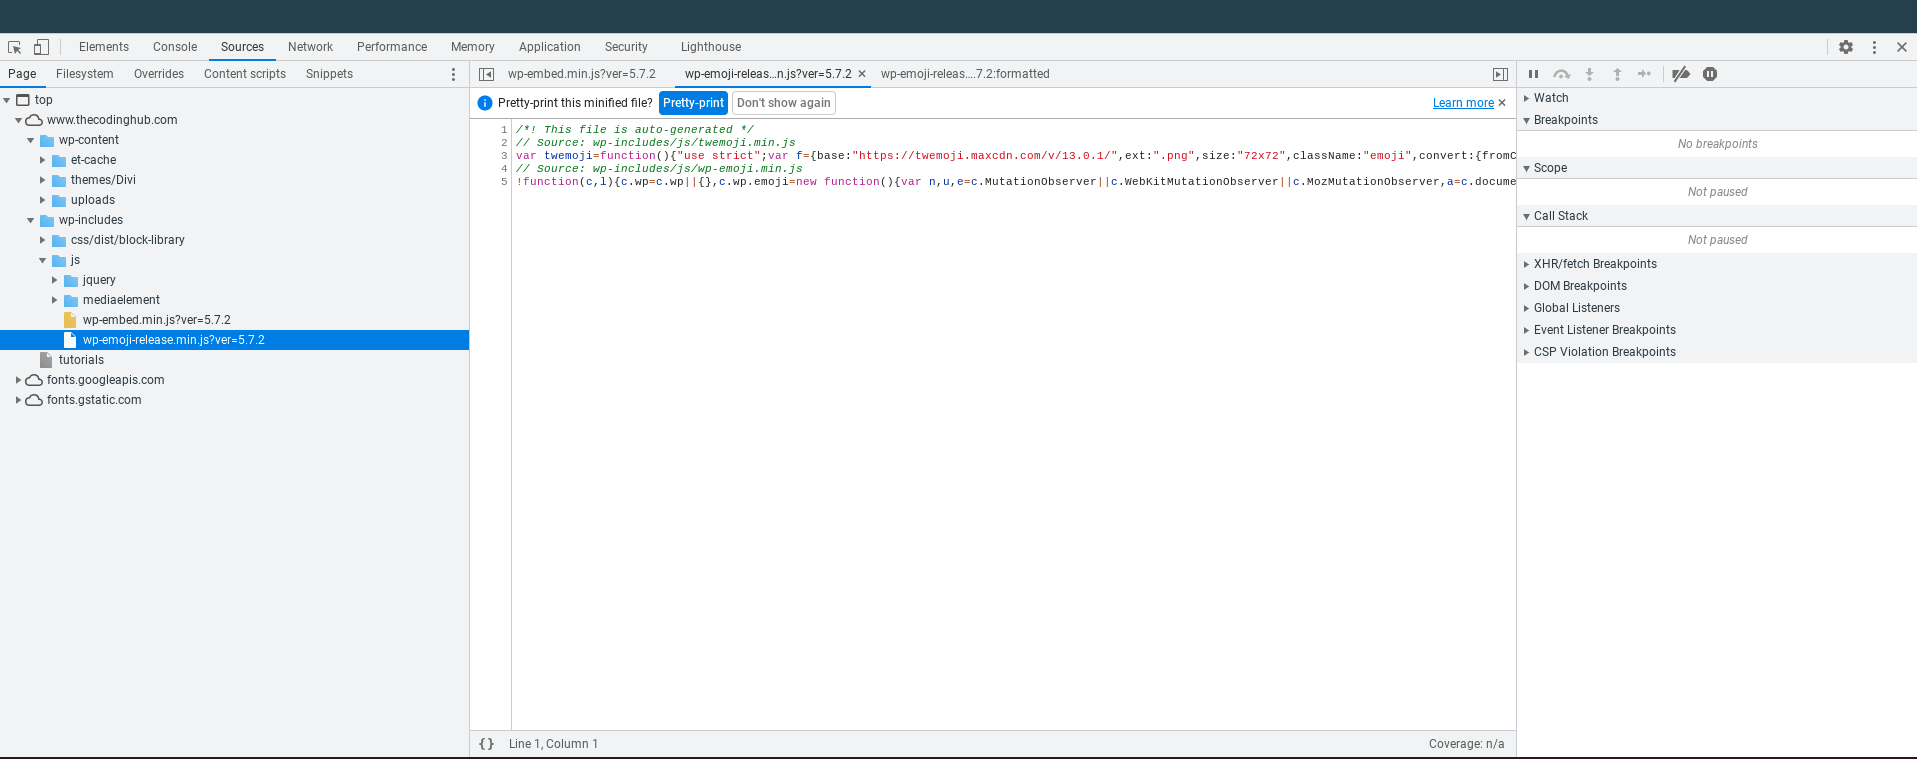
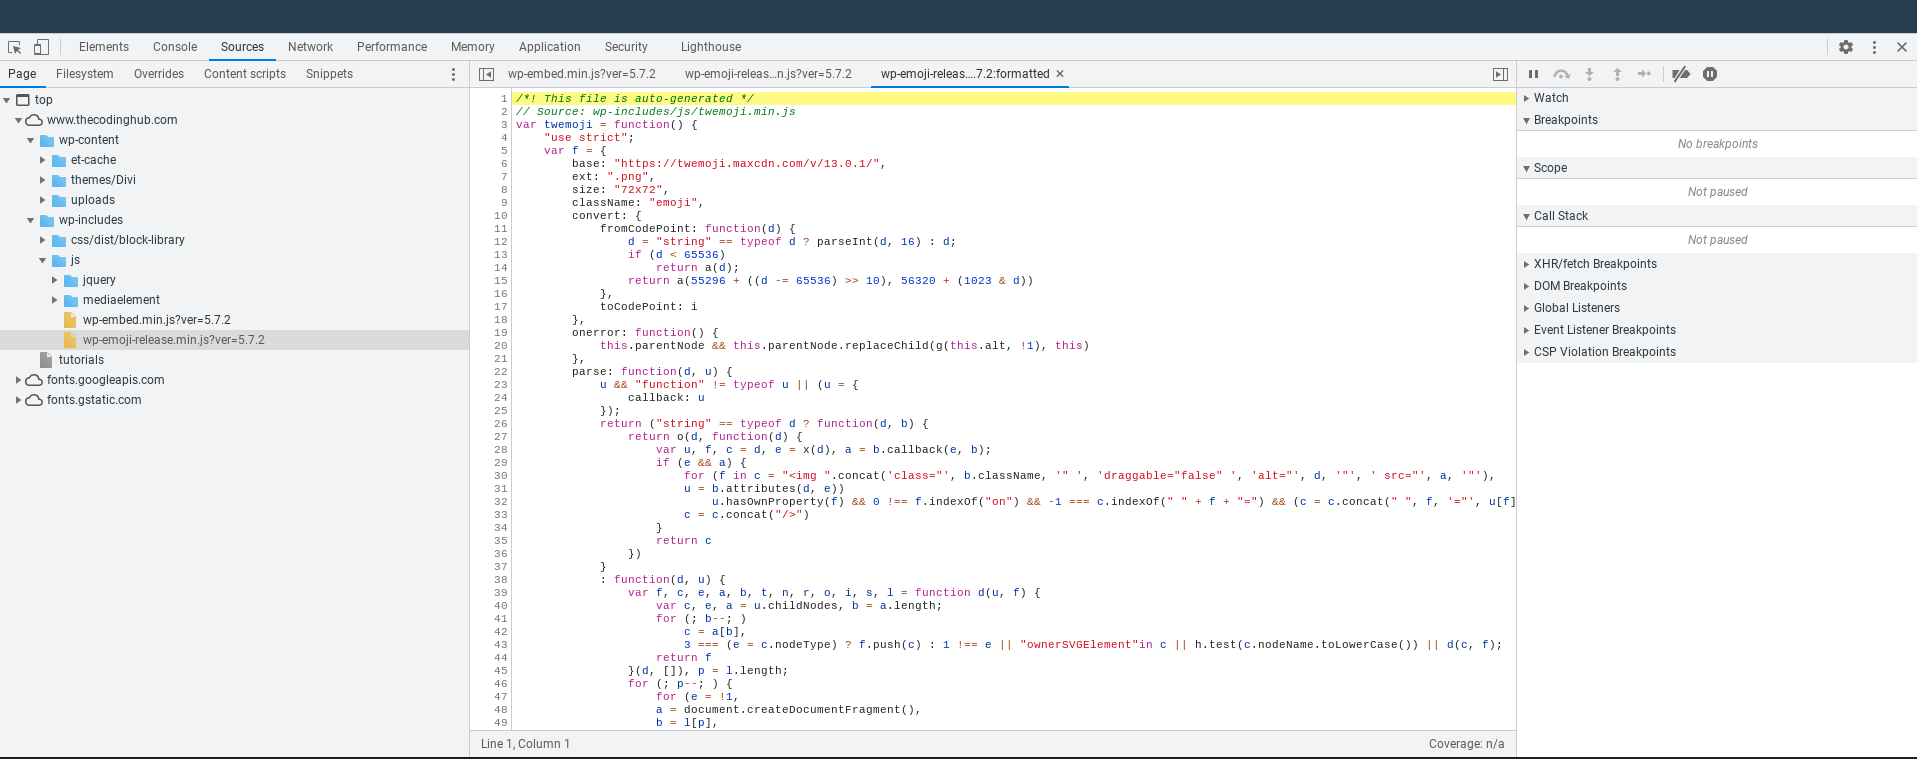
Source
The source tab shows all files that are loaded as part of the page you are currently on. Anything inside the html page head will be displayed in an easy to read way. Minified files have the functionality to be turned into an easy to read formatted code. In the source you can open a javascript file and place breakpoints. Which allows you to debug straight from your browser. This is one of the most important tools you can utilize to test where your code is going wrong.
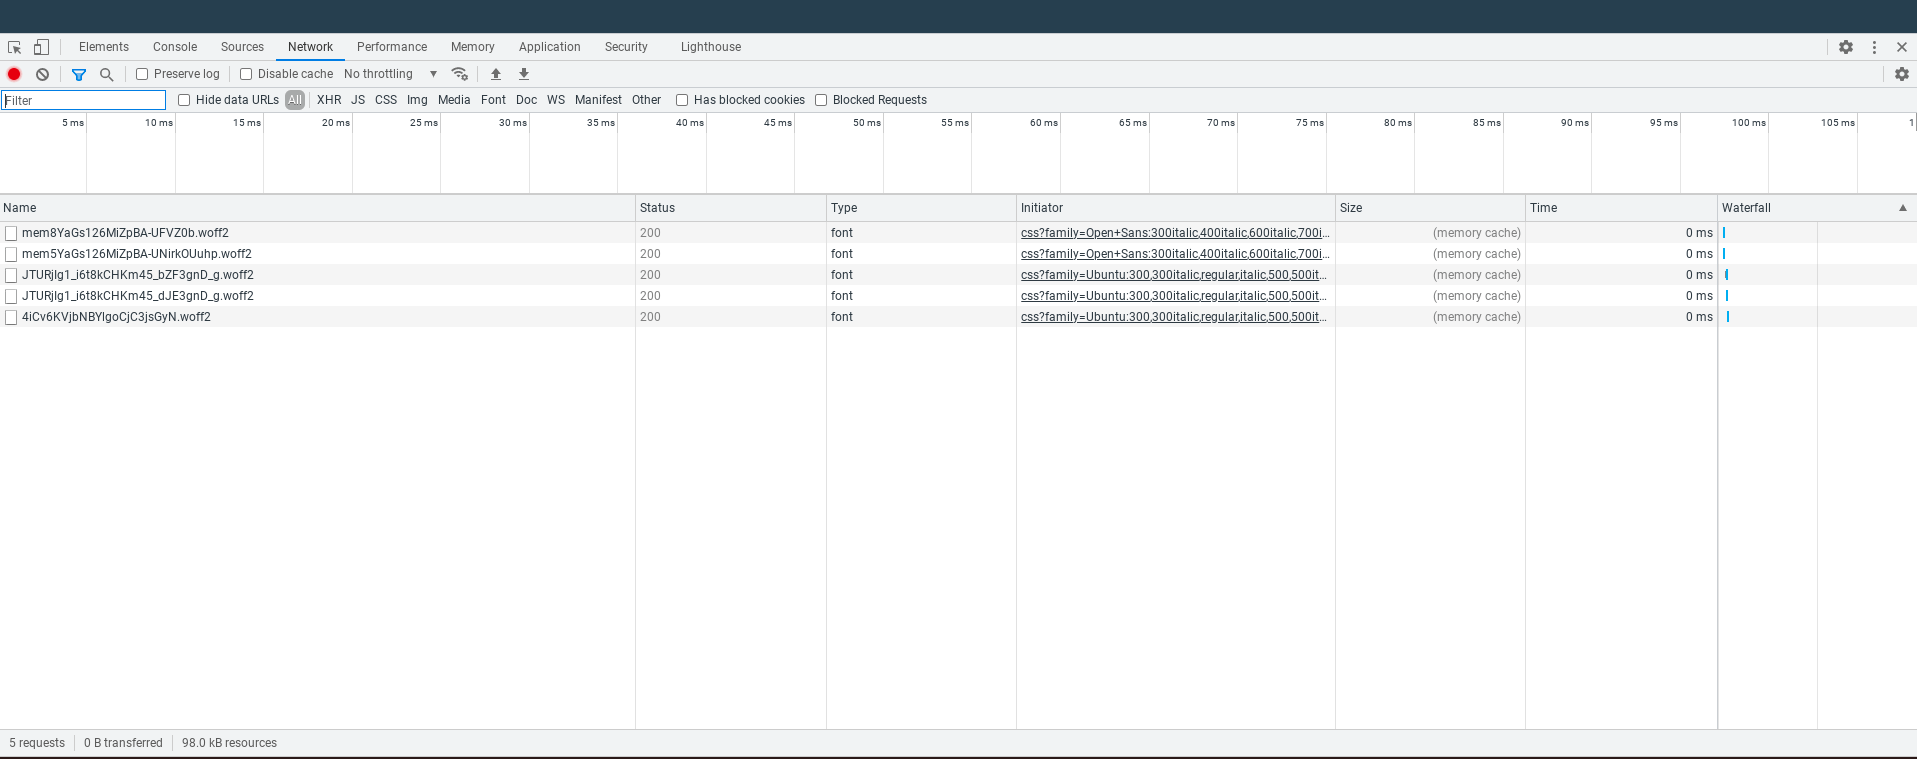
Network
The network tab allows you to view requests made from your browser to any other sources. This is great for reviewing how long a request takes so you can decide what is stopping your application from responding quicker. You can also review request responses and their header and body. This can be beneficial for reviewing API calls and responses.

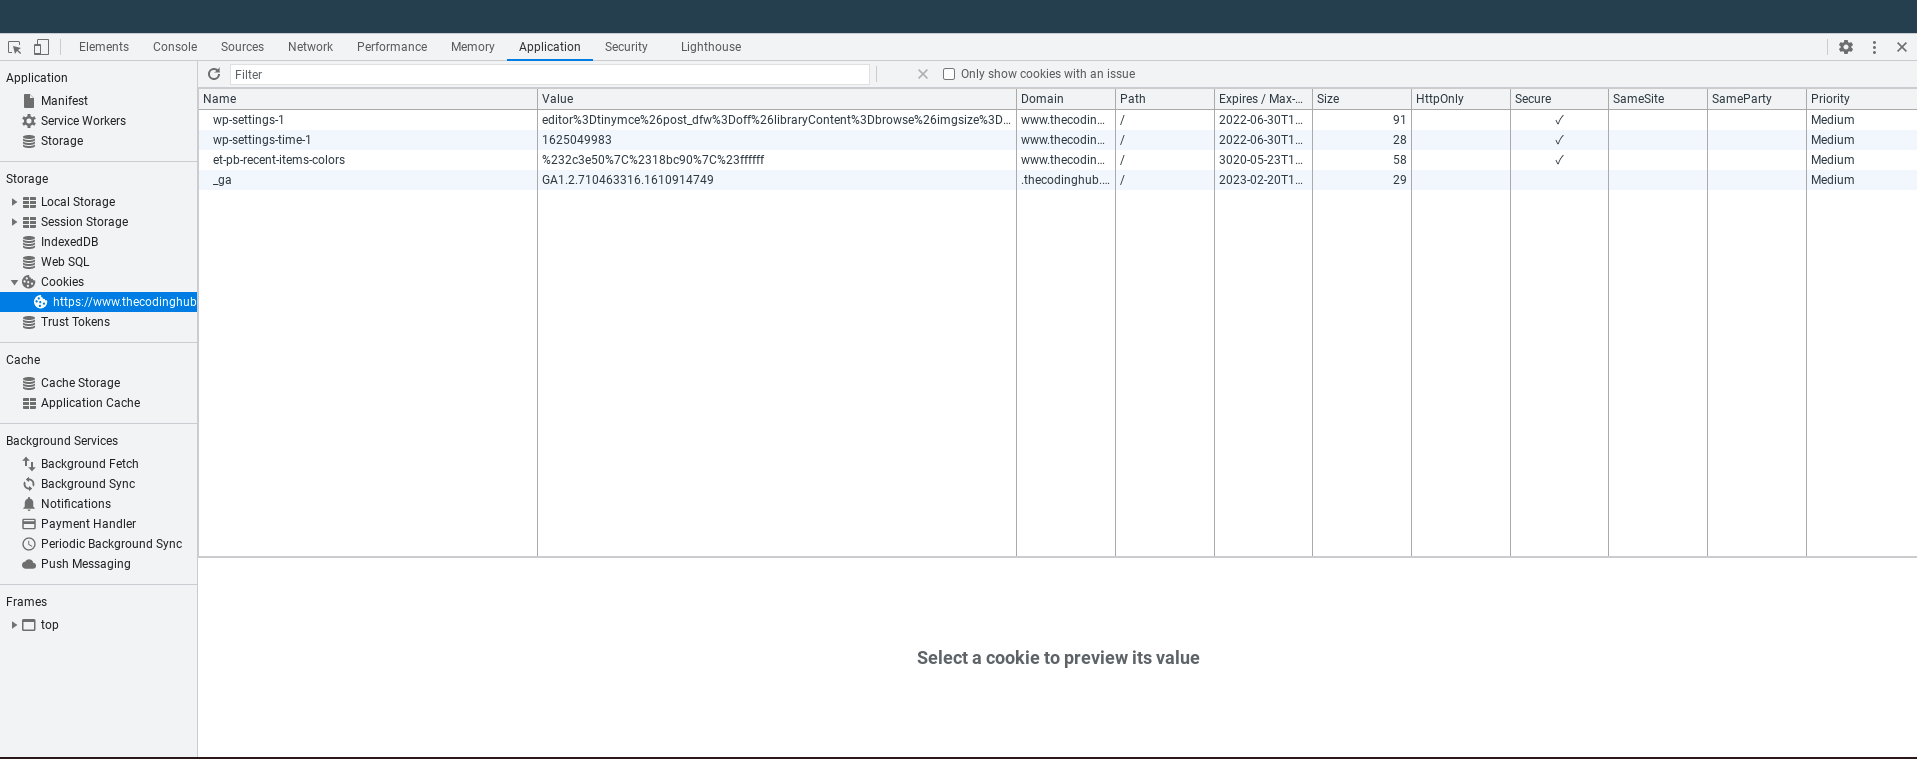
Application
The application tab storage for the current website you are on. You can view the cookies and sessions stored for the current website. You can clear them and change their values to test different scenarios for your website.
These are some of the most important developer tools at your disposal on a browser. There are a few more and some browsers have more unique features. However these are the core ones and you can achieve a lot of different things if used correctly.